
Analyze Procurement Data with Card Integrity
Gain visibility into your spend
There is a wealth of information to be found when you and your organization analyze procurement data. Card Integrity data monitoring and reporting can bridge the gap between having data and knowing it. Better visibility means actionable insights—we don’t just show you your data, our reporting goes the extra mile to show you things like trends, what alerts that make sense for your organization that you aren’t currently using, how you can better optimize your P2P process, how you can increase card rebates, and much more. These reports have been cultivated after years of experience working with clients to understand what sorts of insights that decision makers are looking for, and we’re always adding more and refining as necessary.

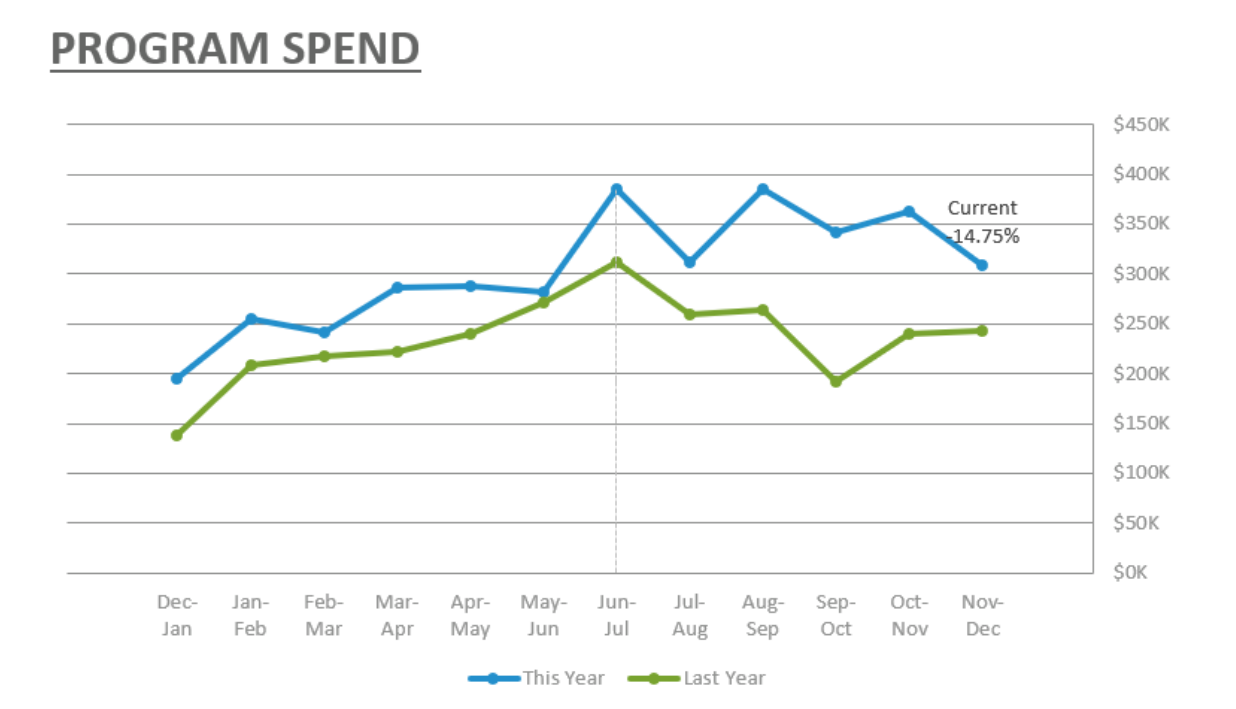

The data above is an example of the kinds of insights Card Integrity can provide. In these examples, you can see supplier diversity spend, overall program spend, and repeat offending cardholders. Note: The names and data shown in these images are randomly generated. This data is strictly illustrational not representative of any real client of Card Integrity.
We can help your program today
If you feel like you have a tough time properly analyzing all the spend data coming in for your organization, you’re certainly not alone. It’s a problem that we’ve helped many clients across various industries solve, including educational institutions and systems (including primary/secondary education to community colleges to universities), corporations, state governments, city and county governments, and more. Increasing visibility may seem unfeasible if you’re just having trouble keeping up with the day to day. That’s where we come in. To gain increased visibility into your organization’s spend data, schedule an online demonstration with Card Integrity today!